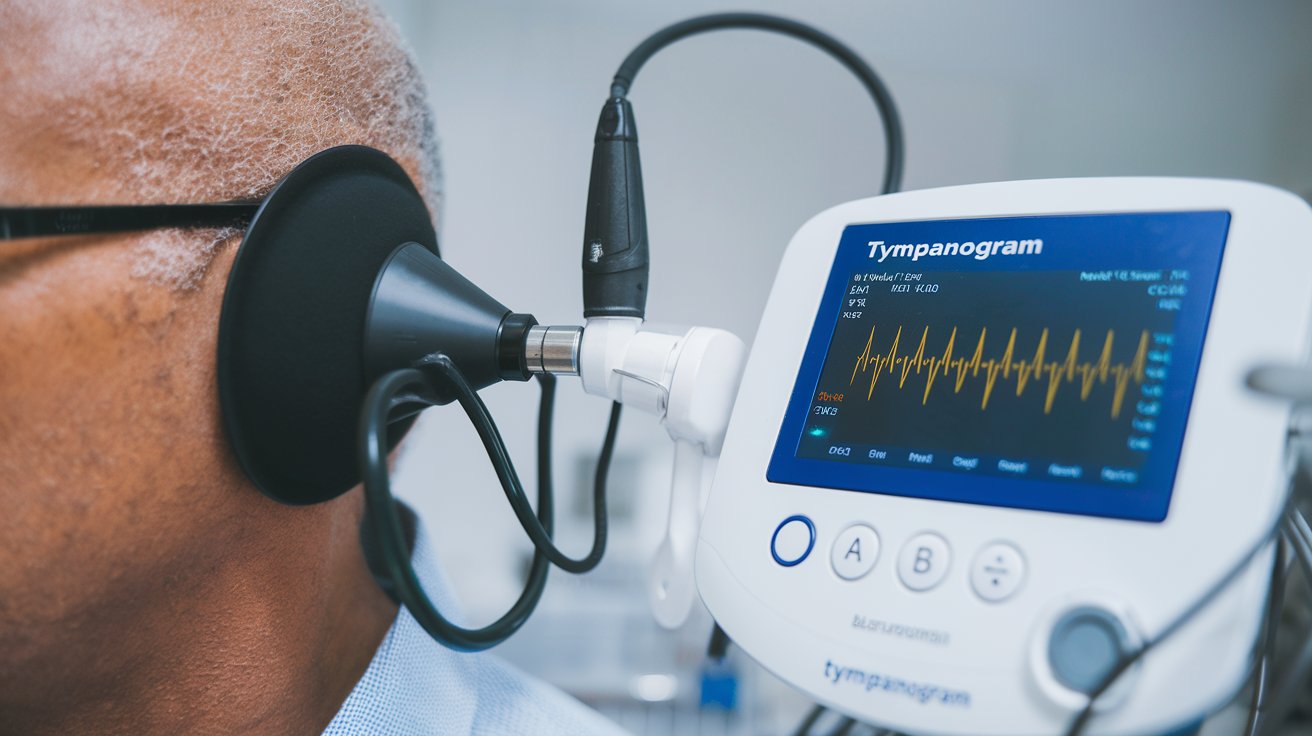
Types of Tympanograms: Complete Guide to Classifications
Tympanometry is a crucial diagnostic tool that measures eardrum mobility and middle ear function by creating pressure changes in the ear canal. Understanding the different types of tympanograms is essential for healthcare professionals to accurately diagnose various ear conditions, from normal hearing to conductive hearing loss and middle ear pathologies.
Understanding Tympanogram Classifications
Tympanograms are classified into five distinct types based on shape, peak pressure, and compliance measurements. Each type provides specific information about middle ear function and potential pathologies. The classification system helps audiologists and ENT specialists identify conditions ranging from normal ear function to various degrees of hearing impairment. This standardized approach ensures consistent interpretation across healthcare facilities in the United States.
The tympanogram classification system was developed to provide objective measurements of eardrum mobility and middle ear pressure. These measurements are plotted on a graph showing compliance (y-axis) versus pressure (x-axis), creating characteristic curve patterns that indicate specific ear conditions. Understanding these patterns is crucial for accurate diagnosis and treatment planning in clinical practice.
Type A Tympanogram – Normal Results
A normal Type A tympanogram displays a bell-shaped curve with peak compliance occurring between -100 to +50 daPa pressure. This pattern indicates proper eardrum mobility and normal middle ear function. The peak represents the point where the eardrum moves most freely, typically occurring when ear canal pressure equals middle ear pressure. Type A results suggest healthy hearing mechanisms without significant conductive hearing loss.
Clinical studies from 2024 show that approximately 85% of healthy adults in the United States demonstrate Type A tympanograms during routine hearing evaluations. The normal compliance range typically measures between 0.3 to 1.5 ml, though individual variations exist based on age, gender, and ear anatomy. Healthcare providers consider Type A results as baseline normal when evaluating treatment outcomes and monitoring ear health over time.
Type As Tympanogram – Reduced Mobility
Type As tympanograms show a shallow, reduced peak compared to normal Type A patterns, indicating decreased eardrum mobility. The peak pressure typically remains within normal limits, but compliance is significantly reduced below 0.3 ml. This pattern commonly occurs with conditions that stiffen the middle ear system, affecting sound transmission to the inner ear.
Type As Tympanogram Causes
The primary Type As tympanogram causes include otosclerosis, middle ear scarring from previous infections, and ossicular chain fixation. Otosclerosis, affecting approximately 3% of adults in the United States, causes abnormal bone growth that restricts stapes movement. Chronic otitis media can lead to scar tissue formation, creating permanent stiffness in the middle ear structures that reduces eardrum mobility.
Type As Tympanogram Treatment
Treatment for conditions causing Type As tympanogram patterns varies depending on the underlying pathology. Otosclerosis may require stapedectomy surgery to restore hearing, while ossicular chain reconstruction can address fixation issues. Conservative management includes hearing aids for patients unsuitable for surgery, with success rates exceeding 90% for appropriate candidates according to 2024 clinical data.
Type Ad Tympanogram – Excessive Mobility
Type Ad tympanograms demonstrate abnormally high compliance values exceeding 1.5 ml, indicating excessive eardrum mobility. The peak typically occurs within normal pressure ranges, but the increased compliance suggests reduced stiffness in the middle ear system. This pattern often indicates disruption of the ossicular chain or other structural abnormalities affecting middle ear mechanics.
Type Ad Tympanogram Causes
Common Type Ad tympanogram causes include ossicular chain disruption from trauma, chronic otitis media complications, and congenital middle ear malformations. Acoustic trauma from loud noise exposure can damage delicate middle ear bones, while severe infections may erode ossicular structures. These conditions result in excessive eardrum movement due to reduced middle ear stiffness and impaired sound transmission mechanisms.
Clinical Significance of Type Ad Results
Type Ad patterns require thorough audiological evaluation to determine the extent of hearing loss and appropriate treatment options. Surgical intervention, including ossiculoplasty or tympanoplasty, may be necessary to restore proper middle ear function. Success rates for ossicular reconstruction surgery range from 70-85% in experienced surgical centers, with patient outcomes improving significantly when performed within optimal timeframes.
Type B Tympanogram – Flat Response
Type B tympanograms display a flat or nearly flat curve with minimal or no identifiable peak, indicating severely restricted eardrum movement. This pattern suggests fluid in the middle ear, complete blockage, or other conditions preventing normal eardrum mobility. The absence of a compliance peak makes pressure measurement impossible, requiring additional diagnostic testing for accurate assessment.
Type B Tympanogram Causes
The most common Type B tympanogram causes include middle ear effusion, cerumen impaction, and eardrum perforation. Otitis media with effusion affects approximately 15% of children in the United States annually, creating fluid accumulation that prevents normal eardrum movement. Complete ear canal blockage from excessive wax or foreign objects can also produce flat tympanogram patterns requiring immediate medical attention.
Type B Tympanogram Treatment
Effective Type B tympanogram treatment depends on the underlying cause and may include medical management, surgical intervention, or procedural removal of obstructions. Middle ear effusion often resolves with antibiotic therapy or steroid treatment, while persistent cases may require myringotomy tube placement. Cerumen removal provides immediate resolution when wax impaction causes the flat response pattern, with success rates approaching 100% for appropriate cases.
Type C Tympanogram – Negative Pressure
Type C tympanograms show a peak shifted toward negative pressure beyond -100 daPa, indicating eustachian tube dysfunction and negative middle ear pressure. The curve maintains normal shape and compliance but occurs at abnormal pressure values. This pattern commonly precedes middle ear effusion and suggests impaired middle ear ventilation requiring prompt medical evaluation.
Type C Tympanogram Causes
Primary Type C tympanogram causes include eustachian tube dysfunction, upper respiratory infections, and allergic rhinitis. Viral infections affect eustachian tube function in approximately 60% of cases, creating negative pressure buildup in the middle ear space. Seasonal allergies and chronic sinusitis contribute to eustachian tube swelling, preventing proper pressure equalization and leading to characteristic negative pressure patterns on tympanometry testing.
Management of Type C Patterns
Treatment of Type C tympanogram conditions focuses on addressing eustachian tube dysfunction and preventing progression to middle ear effusion. Conservative approaches include nasal decongestants, antihistamines for allergy management, and autoinflation techniques to improve eustachian tube function. Severe cases may require surgical intervention such as balloon dilation or pressure equalization tube insertion to restore normal middle ear pressure and prevent hearing loss.
Interpreting Abnormal Tympanometry Results
Accurate interpretation of abnormal tympanometry results requires comprehensive understanding of patient history, clinical symptoms, and additional audiological testing. Healthcare providers must consider factors such as age, previous ear infections, surgical history, and current medications when evaluating tympanogram patterns. Correlation with pure tone audiometry and otoscopic examination provides complete diagnostic information for treatment planning.
Current clinical protocols in the United States emphasize the importance of serial tympanometry testing to monitor changes over time and evaluate treatment effectiveness. Baseline measurements establish normal patterns for individual patients, while follow-up testing tracks improvement or deterioration of middle ear function. This approach enables healthcare providers to make informed decisions about medical versus surgical interventions based on objective data trends.
Related video about types of tympanograms
This video complements the article information with a practical visual demonstration.
Most asked questions about types of tympanograms
What type of tympanogram is considered normal?
A Type A tympanogram is considered normal, displaying a bell-shaped curve with peak compliance between -100 to +50 daPa pressure and compliance values of 0.3-1.5 ml. This pattern indicates proper eardrum mobility and healthy middle ear function without conductive hearing loss.
What causes a type C tympanogram?
Type C tympanograms are primarily caused by eustachian tube dysfunction, upper respiratory infections, and allergic rhinitis. These conditions create negative middle ear pressure beyond -100 daPa, shifting the tympanogram peak toward negative pressure values while maintaining normal curve shape and compliance.
What is abnormal tympanometry?
Abnormal tympanometry includes Types As, Ad, B, and C patterns that deviate from normal Type A curves. These patterns indicate various middle ear pathologies such as reduced mobility (As), excessive mobility (Ad), fluid presence (B), or negative pressure (C), each requiring specific diagnostic evaluation and treatment approaches.
What is a Type B tympanogram seen in?
Type B tympanograms are commonly seen in middle ear effusion, cerumen impaction, eardrum perforation, and complete ear canal blockage. The flat response pattern indicates severely restricted eardrum movement, preventing normal compliance measurements and requiring additional diagnostic testing for accurate assessment.
How accurate are tympanograms for diagnosing ear problems?
Tympanograms demonstrate high accuracy rates of 85-95% when combined with clinical examination and patient history. They provide objective measurements of middle ear function, helping healthcare providers distinguish between conductive and sensorineural hearing loss while monitoring treatment effectiveness over time.
Can tympanogram results change over time?
Yes, tympanogram results can change significantly over time based on treatment response, disease progression, or seasonal factors like allergies. Serial testing is recommended to monitor middle ear function, evaluate treatment effectiveness, and detect new pathologies that may develop in previously normal ears.
| Tympanogram Type | Key Characteristics | Clinical Significance |
|---|---|---|
| Type A (Normal) | Bell-shaped curve, -100 to +50 daPa peak, 0.3-1.5 ml compliance | Indicates healthy middle ear function |
| Type As | Shallow peak, reduced compliance <0.3 ml | Suggests otosclerosis or ossicular fixation |
| Type Ad | High compliance >1.5 ml, excessive mobility | Indicates ossicular chain disruption |
| Type B | Flat response, no identifiable peak | Shows fluid presence or complete blockage |
| Type C | Peak shifted beyond -100 daPa negative pressure | Reveals eustachian tube dysfunction |