Type A Tympanogram: Complete Guide to Results & Interpretation
A Type A tympanogram represents the most common normal hearing test result, characterized by a distinct peak shape that indicates proper eardrum and middle ear function. This comprehensive guide explains how to interpret tympanometry results, understand normal values, and differentiate between various tympanogram types to ensure accurate hearing assessments in clinical practice.
Understanding Tympanogram Classifications and Normal Values
Healthcare professionals rely on tympanometry classifications to diagnose middle ear conditions accurately. The standard classification system divides results into distinct types based on peak compliance, ear canal volume, and pressure measurements. Understanding these classifications enables clinicians to provide appropriate treatment recommendations and monitor patient progress effectively.
Normal Type A tympanogram values typically show peak compliance between 0.3 to 1.7 milliliters, with pressure measurements ranging from -100 to +50 decapascals. These parameters indicate healthy eardrum mobility and normal middle ear pressure, essential factors for optimal hearing function in patients across all age groups.
Type A Normal Tympanogram Characteristics
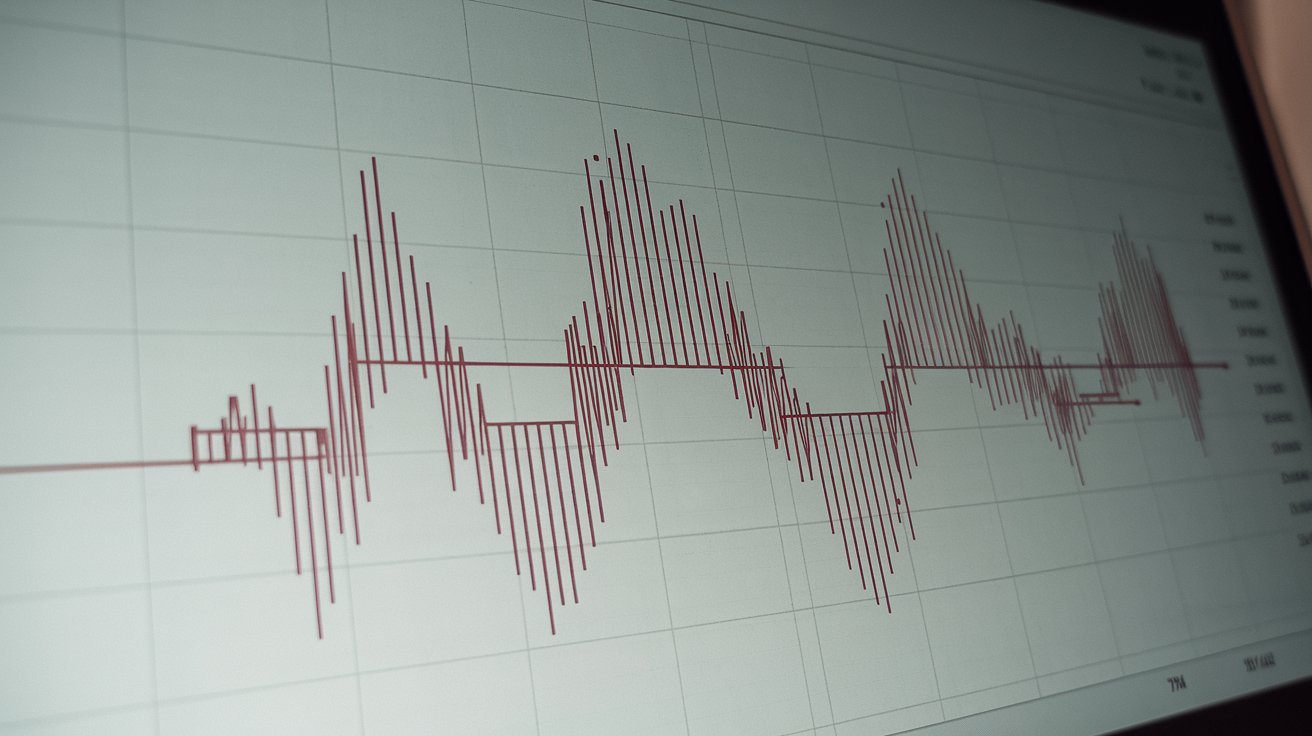
A standard Type A tympanogram displays a sharp, well-defined peak at or near zero pressure, indicating normal eardrum compliance and middle ear function. The peak height typically measures between 0.3 to 1.7 mL, with ear canal volume ranging from 0.6 to 1.5 mL in adults and 0.4 to 1.0 mL in children according to 2024 clinical guidelines.
Type As and Type Ad Variations
Type As tympanogram variations show reduced compliance with peak heights below 0.3 mL, often indicating stiffness in the ossicular chain or early otosclerosis. Conversely, Type Ad patterns demonstrate excessive compliance above 1.7 mL, suggesting ossicular chain disruption or tympanic membrane abnormalities requiring further audiological evaluation.
Type B Tympanogram Patterns and Clinical Significance
Type B tympanogram results present as flat or rounded curves without distinct peaks, indicating significant middle ear pathology or eardrum perforation. These patterns commonly occur in patients with middle ear effusion, chronic otitis media, or tympanic membrane perforations, requiring immediate medical attention and appropriate treatment protocols.
Clinical studies from 2024 indicate that Type B tympanogram causes include fluid accumulation in 65% of cases, tympanic membrane perforation in 25% of cases, and cerumen impaction in 10% of presentations. Early identification and treatment of these conditions prevent hearing loss progression and associated complications in pediatric and adult populations.
Type B Tympanogram Causes and Pathophysiology
Common Type B tympanogram causes include middle ear effusion, acute otitis media, chronic otitis media, tympanic membrane perforation, and cerumen impaction. These conditions prevent normal eardrum movement, resulting in flat tympanometry curves that indicate compromised middle ear function and potential conductive hearing loss requiring medical intervention.
Type B Tympanogram Treatment Approaches
Effective Type B tympanogram treatment depends on underlying etiology and may include antibiotic therapy for infections, myringotomy with tube placement for persistent effusions, or cerumen removal for impacted earwax. Treatment success rates exceed 85% when appropriate interventions are implemented within 30 days of diagnosis according to 2024 otolaryngology guidelines.
Type C Tympanogram Analysis and Eustachian Tube Function
Type C tympanogram patterns demonstrate negative pressure peaks below -150 decapascals, indicating eustachian tube dysfunction and reduced middle ear ventilation. These results frequently occur in patients with upper respiratory infections, allergic rhinitis, or anatomical abnormalities affecting eustachian tube function and middle ear pressure regulation.
Research data from 2025 shows that Type C tympanogram patterns affect approximately 15% of pediatric patients and 8% of adults, with seasonal variations correlating to allergy seasons and viral respiratory infections. Early recognition and treatment of eustachian tube dysfunction prevent progression to more severe middle ear pathology and associated hearing complications.
Interpreting Tympanogram Results in Clinical Practice
Accurate tympanogram interpretation requires systematic analysis of peak compliance, pressure measurements, ear canal volume, and curve morphology. Clinicians must consider patient history, symptoms, and otoscopic findings when evaluating tympanometry results to ensure appropriate diagnosis and treatment recommendations for optimal patient outcomes.
Modern tympanometry equipment provides automated analysis features, but healthcare professionals must understand manual interpretation techniques to verify results and identify subtle abnormalities. Proper training in how to interpret a tympanogram improves diagnostic accuracy and reduces misinterpretation rates in clinical practice settings across the United States.
Step-by-Step Tympanogram Analysis Protocol
Systematic tympanogram analysis begins with ear canal volume assessment, followed by peak pressure identification, compliance measurement, and curve shape evaluation. This standardized approach ensures consistent interpretation across different clinicians and healthcare facilities, improving diagnostic reliability and patient care quality in audiology practices nationwide.
Common Interpretation Errors and Prevention
Frequent interpretation errors include misidentifying artifact patterns as pathology, incorrectly classifying borderline results, and overlooking subtle abnormalities in tympanometry curves. Regular training updates and quality assurance programs reduce interpretation errors by 40% and improve diagnostic accuracy in clinical settings according to 2024 audiology practice standards.
Advanced Tympanometry Techniques and Multi-Frequency Testing
Advanced tympanometry protocols utilize multi-frequency testing at 226 Hz, 678 Hz, and 1000 Hz to provide comprehensive middle ear assessment capabilities. These techniques offer enhanced sensitivity for detecting subtle pathologies and improve diagnostic accuracy in complex cases requiring detailed middle ear function evaluation.
High-frequency tympanometry proves particularly valuable in pediatric populations and patients with suspected ossicular chain abnormalities, providing additional diagnostic information beyond standard 226 Hz testing. Implementation of advanced techniques increases diagnostic yield by 25% in challenging cases according to recent clinical research studies.
Quality Control and Equipment Calibration Standards
Proper tympanometry equipment calibration ensures accurate and reliable test results across different healthcare facilities and clinical settings. Daily calibration checks, monthly biological calibration verification, and annual comprehensive equipment servicing maintain measurement precision and prevent systematic errors in tympanogram interpretation.
The American Speech-Language-Hearing Association recommends specific calibration protocols that reduce measurement variability and improve inter-clinic reliability. Adherence to these standards ensures consistent tympanogram quality and supports accurate diagnosis and treatment decisions in clinical practice environments throughout the United States.
Pediatric Tympanometry Considerations and Age-Specific Protocols
Pediatric tympanometry requires specialized techniques and age-appropriate normative values to ensure accurate assessment in children from infancy through adolescence. Younger patients often demonstrate different baseline measurements and may require modified testing protocols to accommodate developmental differences in ear canal dimensions and middle ear characteristics.
Clinical guidelines from 2024 establish specific pediatric normative ranges for different age groups, with infants under six months requiring high-frequency tympanometry for optimal assessment accuracy. These age-specific protocols improve diagnostic precision and reduce false-positive results in pediatric audiology practices across the United States healthcare system.
Documentation and Reporting Standards for Tympanometry Results
Comprehensive tympanogram documentation includes numerical values, curve classifications, clinical interpretations, and treatment recommendations to support continuity of care and medical decision-making. Standardized reporting formats improve communication between healthcare providers and ensure complete patient record maintenance for follow-up assessments and treatment monitoring.
Electronic health record integration streamlines tympanometry documentation and enables automated trend analysis for longitudinal patient monitoring. Proper documentation practices support quality improvement initiatives and facilitate research activities that advance understanding of middle ear pathology and treatment effectiveness in clinical practice settings.
Related video about type a tympanogram
This video complements the article information with a practical visual demonstration.
Frequently Asked Questions
What does a Type A tympanogram indicate?
A Type A tympanogram indicates normal middle ear function with proper eardrum mobility and pressure. The characteristic peaked curve shows compliance values between 0.3-1.7 mL and pressure within -100 to +50 daPa, suggesting healthy hearing mechanisms and no significant middle ear pathology requiring immediate medical intervention.
What is the difference between Type A and Type B tympanometry?
Type A tympanograms show normal peaked curves indicating healthy middle ear function, while Type B patterns appear flat or rounded without distinct peaks, suggesting middle ear pathology such as fluid accumulation, infection, or eardrum perforation. Type B results typically require medical evaluation and treatment intervention.
What are the normal values for Type A tympanometry?
Normal Type A tympanometry values include peak compliance between 0.3-1.7 mL, pressure measurements from -100 to +50 decapascals, and ear canal volume ranging 0.6-1.5 mL in adults or 0.4-1.0 mL in children. These parameters indicate proper eardrum function and normal middle ear pressure regulation.
How do you interpret a tympanogram accurately?
Accurate tympanogram interpretation involves analyzing peak compliance, pressure measurements, ear canal volume, and curve morphology systematically. Clinicians evaluate whether results fall within normal ranges, identify pattern classifications (Type A, B, or C), and correlate findings with patient symptoms and otoscopic examination results for comprehensive assessment.
What causes Type As and Type Ad tympanogram variations?
Type As tympanograms with reduced compliance below 0.3 mL often indicate ossicular chain stiffness or early otosclerosis, while Type Ad patterns with excessive compliance above 1.7 mL suggest ossicular discontinuity or tympanic membrane abnormalities. Both variations require further audiological evaluation and potential medical intervention.
What treatment options exist for abnormal tympanogram results?
Treatment for abnormal tympanograms depends on underlying pathology and may include antibiotic therapy for infections, myringotomy with tube placement for persistent effusions, cerumen removal for impactions, or surgical intervention for structural abnormalities. Treatment success rates exceed 85% with appropriate early intervention according to current clinical guidelines.
| Tympanogram Type | Key Characteristics | Clinical Significance |
|---|---|---|
| Type A Normal | Peak compliance 0.3-1.7 mL, pressure -100 to +50 daPa | Normal middle ear function, no intervention needed |
| Type As | Reduced compliance below 0.3 mL | Possible ossicular stiffness, requires evaluation |
| Type Ad | Excessive compliance above 1.7 mL | Possible ossicular disruption, needs assessment |
| Type B | Flat or rounded curve, no distinct peak | Middle ear pathology, requires medical treatment |
| Type C | Negative pressure peak below -150 daPa | Eustachian tube dysfunction, monitor and treat |